Summary: Latitude vs. X

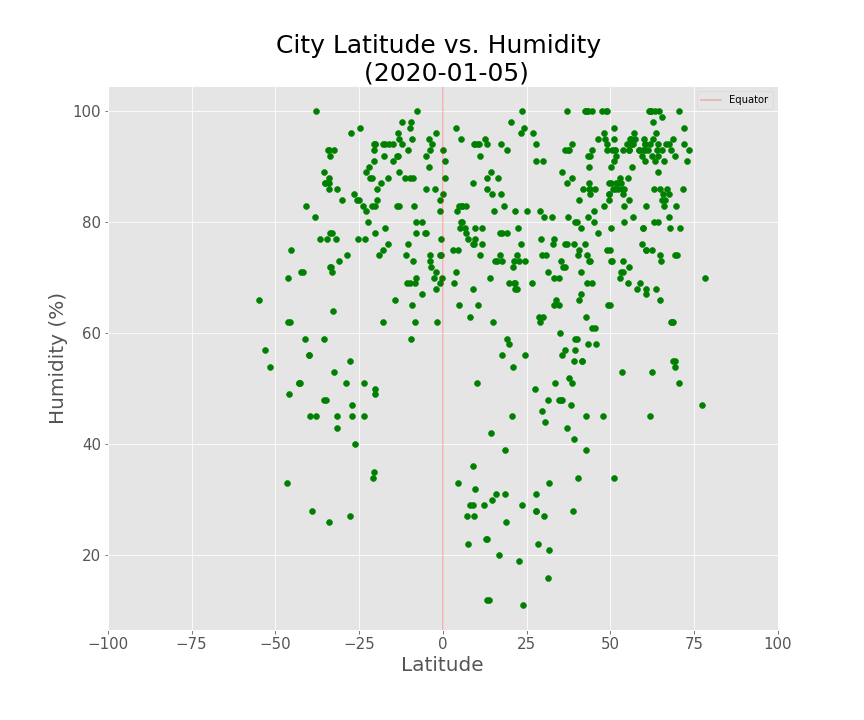
This plot shows there is a cluster of cities near the equator and at about 50 to 70 degrees latitude. The relative humidity is high near the equator because the actual vapor pressure is high. The relative humidity is also high near the poles because the saturation vapor pressure is low. Since cold air can hold less moisture than warm air, as we cool the air it will eventually become saturated.


