Summary: Latitude vs. X
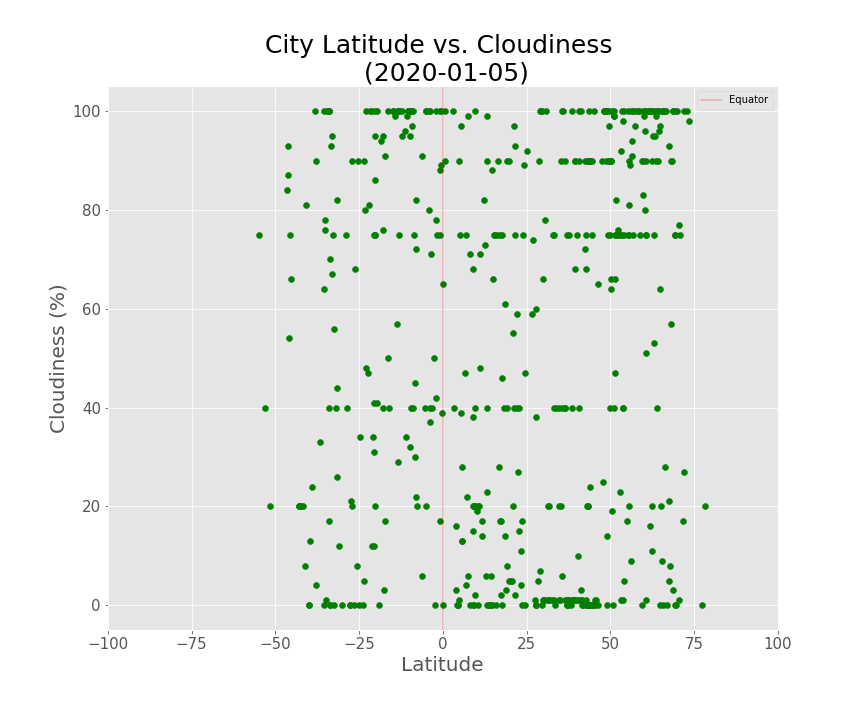
This plot shows that most of the cities from the data are cloudy. One study based on nearly a decade of satellite data estimated that about 67 percent of Earth’s surface is typically covered by clouds. We can also see that a cluster of cities near the equator is 100% cloudy. The band near the equator is a function of the large scale circulation patterns—or Hadley cells—present in the tropics. Hadley cells are defined by cool air sinking near the 30 degree latitude line north and south of the equator and warm air rising near the equator where winds from separate Hadley cells converge. As warm, moist air converges at lower altitudes near the equator, it rises and cools and therefore can hold less moisture. This causes water vapor to condense into cloud particles and produces a dependable band of thunderstorms in an area known as the Inter Tropical Convergence Zone (ITCZ). (source: NASA)
Clouds also tend to form in abundance in the middle latitudes 60 degrees north and south of the equator. There is a cluster of cities at about 60 degrees on the plot that shows 100% cloudy. This is where the edges of polar and mid-latitude (or Ferrel) circulation cells collide and push air upward, fueling the formation of the large-scale frontal systems that dominate weather patterns in the mid-latitudes. While clouds tend to form where air rises as part of atmospheric circulation patterns, descending air inhibits cloud formation. Since air descends between about 15 and 30 degrees north and south of the equator, clouds are rare and deserts are common at this latitude. (source: NASA) The plot shows a cluster of cities with 0% cloudiness at these latitudes.
Visualizations